The E-Commerce Data Problem: Why Your Business Is Flying Blind
As an e-commerce founder, you're making decisions every day based on incomplete information. You know what your gross revenue looks like, but you don't know your true profit by product — because you're not factoring in returns, shipping costs, and the ad spend that drove each sale.
You see traffic in Google Analytics and conversions in Shopify, but you can't connect them. Which marketing channels are actually profitable? How much did each channel really cost to acquire a customer? You're guessing.
You're checking customer value, but you're not accounting for the lifetime picture. A customer bought once, spent $200, and you think they're great. But they also generated two returns and cost you $50 in shipping corrections. Their real profit margin is half what you thought.
This is the core problem: your data lives in separate silos, and manually connecting them is an hours-long spreadsheet exercise that you repeat every week. It's a bottleneck to growth because you can't see clearly enough to optimize.
Where Your E-Commerce Data Actually Lives
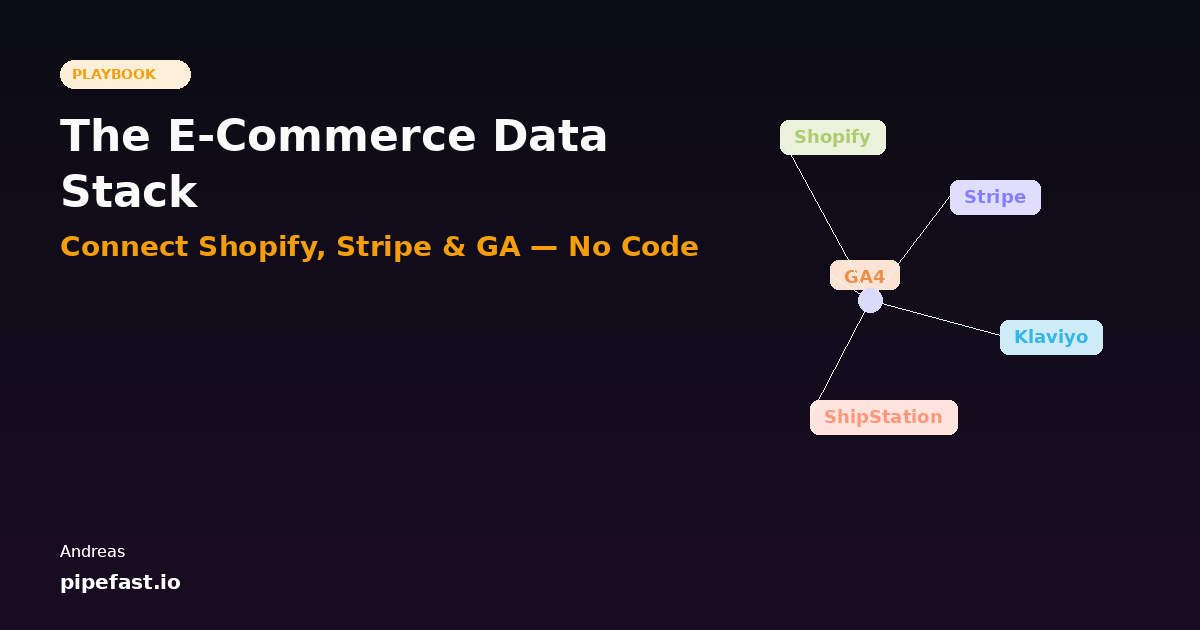
Let's map out the typical e-commerce stack. This is where your business data is hiding:
Shopify is your orders hub. Every purchase, product, customer, and transaction history lives here. But Shopify only tells you about orders — not about profitability, not about what traffic looked like before the purchase, not about whether the customer will buy again.
Stripe has the payment details. Success rates, refunds, subscription revenue, churn, payment method breakdowns. Stripe knows about revenue patterns that your Shopify dashboard misses entirely.
Google Analytics owns the top of the funnel. Traffic sources, conversion rates by channel, time to purchase, user behavior, cohort data. But GA doesn't know what happens after purchase — no profit data, no repeat customers, no lifetime value attribution by source.
Klaviyo or Mailchimp tracks email performance and customer segmentation. Open rates, click rates, customer tiers. They know which customers are engaged — but they don't know customer profitability unless you manually merge that data from Stripe.
ShipStation or Fulfillment API has shipping costs, delivery times, and return logistics. Critical for calculating true product margin — but disconnected from everything else.
Your CRM (if you have one) knows customer interactions, support tickets, and deal stage. But without profit data from Stripe and traffic data from GA, it's just anecdotal.
Here's the painful truth: the questions you most need to answer require data from at least three of these sources. That's why founders end up building spreadsheets. And that's why those spreadsheets are always one update away from breaking.
The Questions You Can't Answer (Yet)
Let me show you what you're missing. These are the questions every successful e-commerce business needs to answer, but can't — because the data is disconnected:
- True customer acquisition cost (CAC) by channel: GA tells you traffic cost, Shopify tells you conversions, but what's the profit per customer after you account for returns and shipping? Only unified data gives you that.
- Customer lifetime value (LTV): You can calculate repeat purchase rate manually, but only if you're combining Shopify historical data with customer segmentation from Klaviyo. That takes hours.
- Product profitability after all costs: Shopify shows revenue per SKU. But the real margin includes returns (Shopify/Stripe), shipping (ShipStation), and the ad spend that drove it (GA). Most founders have no idea which products are actually profitable.
- Cohort analysis by traffic source: GA shows you first-touch source. But how do those cohorts actually perform? Which channels drive repeat customers? You'd need to export GA, merge it with Shopify history, and aggregate it manually.
- Marketing ROI by channel, real-time: Spend is tracked in GA and Ads platforms. Revenue by channel can be inferred from UTM parameters in Shopify. But the matching is manual, error-prone, and never current.
- Churn and retention by customer segment: Klaviyo knows your segments. Stripe knows who's churning. But connecting them to understand which segments are leaving — that requires manual work.
If you can't answer these questions, you can't optimize. You're guessing on budget allocation, product development, and customer acquisition strategy.
The Old Way: CSV Hell and Spreadsheet Nightmares
Right now, here's probably what your data workflow looks like:
Monday morning: You block off 2-3 hours to pull together last week's numbers. You export CSV from Shopify for orders and customers. You export CSV from Stripe for payment details. You export a report from Google Analytics. You open a spreadsheet. You VLOOKUP order IDs to match Shopify and Stripe data. You manually attribute revenue to traffic sources based on UTM parameters (and hope they're filled in correctly). You calculate product margins by looking up costs in another sheet. You paste everything into a dashboard that's out of date by Tuesday.
Wednesday: Someone asks if a product's margins improved from your last price change. You have to redo parts of the calculation.
Thursday: Google Analytics introduces a new data retention policy that breaks your historical cohort data. You spend an hour figuring out what changed.
Friday: You're checking numbers for a board call, and you notice the revenue total doesn't match Stripe. You spend 45 minutes finding the discrepancy. It was because one refund didn't have a UTM parameter.
Next Monday: You do it all again.
This weekly ritual is expensive. It takes your attention away from strategy. It introduces human error. And it means your strategic decisions are always based on last week's data, not real-time insights.
The New Way: Unified Data Without Code
There's a better way. And it doesn't require hiring a data engineer or learning SQL.
The principle is simple: instead of manually exporting CSVs, you connect all your tools together with a data pipeline. The pipeline automatically pulls data from Shopify, Stripe, GA, and the others on a schedule you set (hourly, daily, whenever). It understands the relationships between them. It calculates the metrics you need. And it updates automatically.
Here's how it works in practice with Pipefast:
Step 1: Connect Your Sources
You authenticate with Shopify, Stripe, Google Analytics, and any other tools where your data lives. Pipefast handles all the API connections. You don't need API keys or technical setup — just click "connect" and authenticate through each platform's standard login flow.
Step 2: Tell Pipefast What You Want
Instead of writing SQL or transformation logic, you describe your desired output in plain English. For example:
"I want a daily revenue dashboard showing total revenue by Shopify product category, filtered for paid orders only. Break it down by the traffic source (UTM medium from GA). Also show return rate and average shipping cost for each category from my fulfillment data."
That's it. Pipefast's AI understands your Shopify schema, your GA structure, your Stripe fields, and how they relate. It generates the data pipeline automatically.
Step 3: Your Pipeline Runs Automatically
Every morning at 6am (or whatever time you choose), your pipeline runs. It pulls the latest data from all your sources. It joins Shopify orders with Stripe payments. It matches GA traffic to conversions using UTM parameters. It calculates product margins. And it loads everything into a dashboard or spreadsheet that's ready for you when you wake up.
No manual exporting. No spreadsheet formulas breaking. No human error. Just fresh data, every day.
Step 4: Self-Healing When Things Break
Here's the part that saves you the most time: Pipefast monitors your pipeline and fixes problems automatically. If a Stripe credential expires, the pipeline detects it and alerts you before your data is stale. If GA changes their data structure, Pipefast adapts. If a VLOOKUP-style join breaks because of a schema mismatch, the system identifies it and either fixes it or escalates it with full context.
You don't wake up to find that your data is three days out of date because something broke.
Five Dashboards Every E-Commerce Business Needs
Once you have unified data, here are the dashboards that unlock real business insights:
1. Daily Revenue by Channel
Total revenue, broken down by traffic source (organic, paid search, social, email, referral, direct). Includes conversion rate by channel. Updated daily. This is your starting point for understanding which channels are actually working.
2. Customer Lifetime Value Tracker
Cohorts of customers grouped by acquisition date and source. Tracks repeat purchase rate, repeat revenue, total spend, and churn. This tells you which channels bring sticky customers vs. one-time buyers. It's how you actually measure LTV, not guessing.
3. Product Performance (Margin After All Costs)
Revenue per SKU, minus returns, minus shipping average for that product, minus the CAC you paid to acquire the customers who bought it. This is the only view that matters for product decisions. It tells you which products are actually profitable and which are eating margin.
4. Marketing Spend vs. Revenue
Your ad spend by channel (from GA, your Facebook Ads account, Google Ads API) matched against revenue generated by that channel. Calculate ROAS, payback period, and profitability. This is your ROI engine — where you see which marketing dollar is working.
5. Inventory Health
Stock levels, turnover rate, and sell-through rate by product. Matched with demand signals from GA (search volume, traffic to that product page) and profitability data. This helps you make smarter inventory decisions.
Once these five dashboards exist and update automatically, you have a real operating system for your business. You can see what's working, optimize with confidence, and stop wasting time on spreadsheets.
Getting Started: What You Can Do Right Now
You don't need to wait for new tools or for anything to launch. Start today with this three-step audit:
Step 1: Audit Your Tools
List every platform where your business data lives. Not just the big ones — include email marketing, SMS, reviews platforms, affiliate networks, shipping providers, and anything else that tracks customer or revenue data. Most e-commerce founders are shocked to find they're using 10-15 tools with disconnected data.
Step 2: Identify Your Top 3 Questions
What are the three things you'd most like to see every morning that you currently can't? Which questions are blocking your growth? Write them down specifically. These will be your first pipelines.
Don't say "I want better analytics." Say "I want to see daily revenue by product, broken down by traffic source, with return rate and shipping costs included." Specificity helps AI understand what you need.
Step 3: Join the Pipefast Waitlist
Pipefast launches within weeks. When it does, you'll be able to connect all these tools, describe what you want, and have working dashboards within minutes. No engineers, no code, no spreadsheets.
Ready to unify your e-commerce data stack?
Stop exporting CSVs and building spreadsheets. Pipefast connects Shopify, Stripe, GA, and everything else into one automated data system. Join the waitlist for early access.
Join the Waitlist